New sales are loud. An order comes in, an invoice goes out, someone posts it in the group chat. Churn is quiet. A customer cancels, your recurring revenue drops a little, and nothing else visible happens.
That silence is the whole problem. The arithmetic itself is nothing.
The two formulas
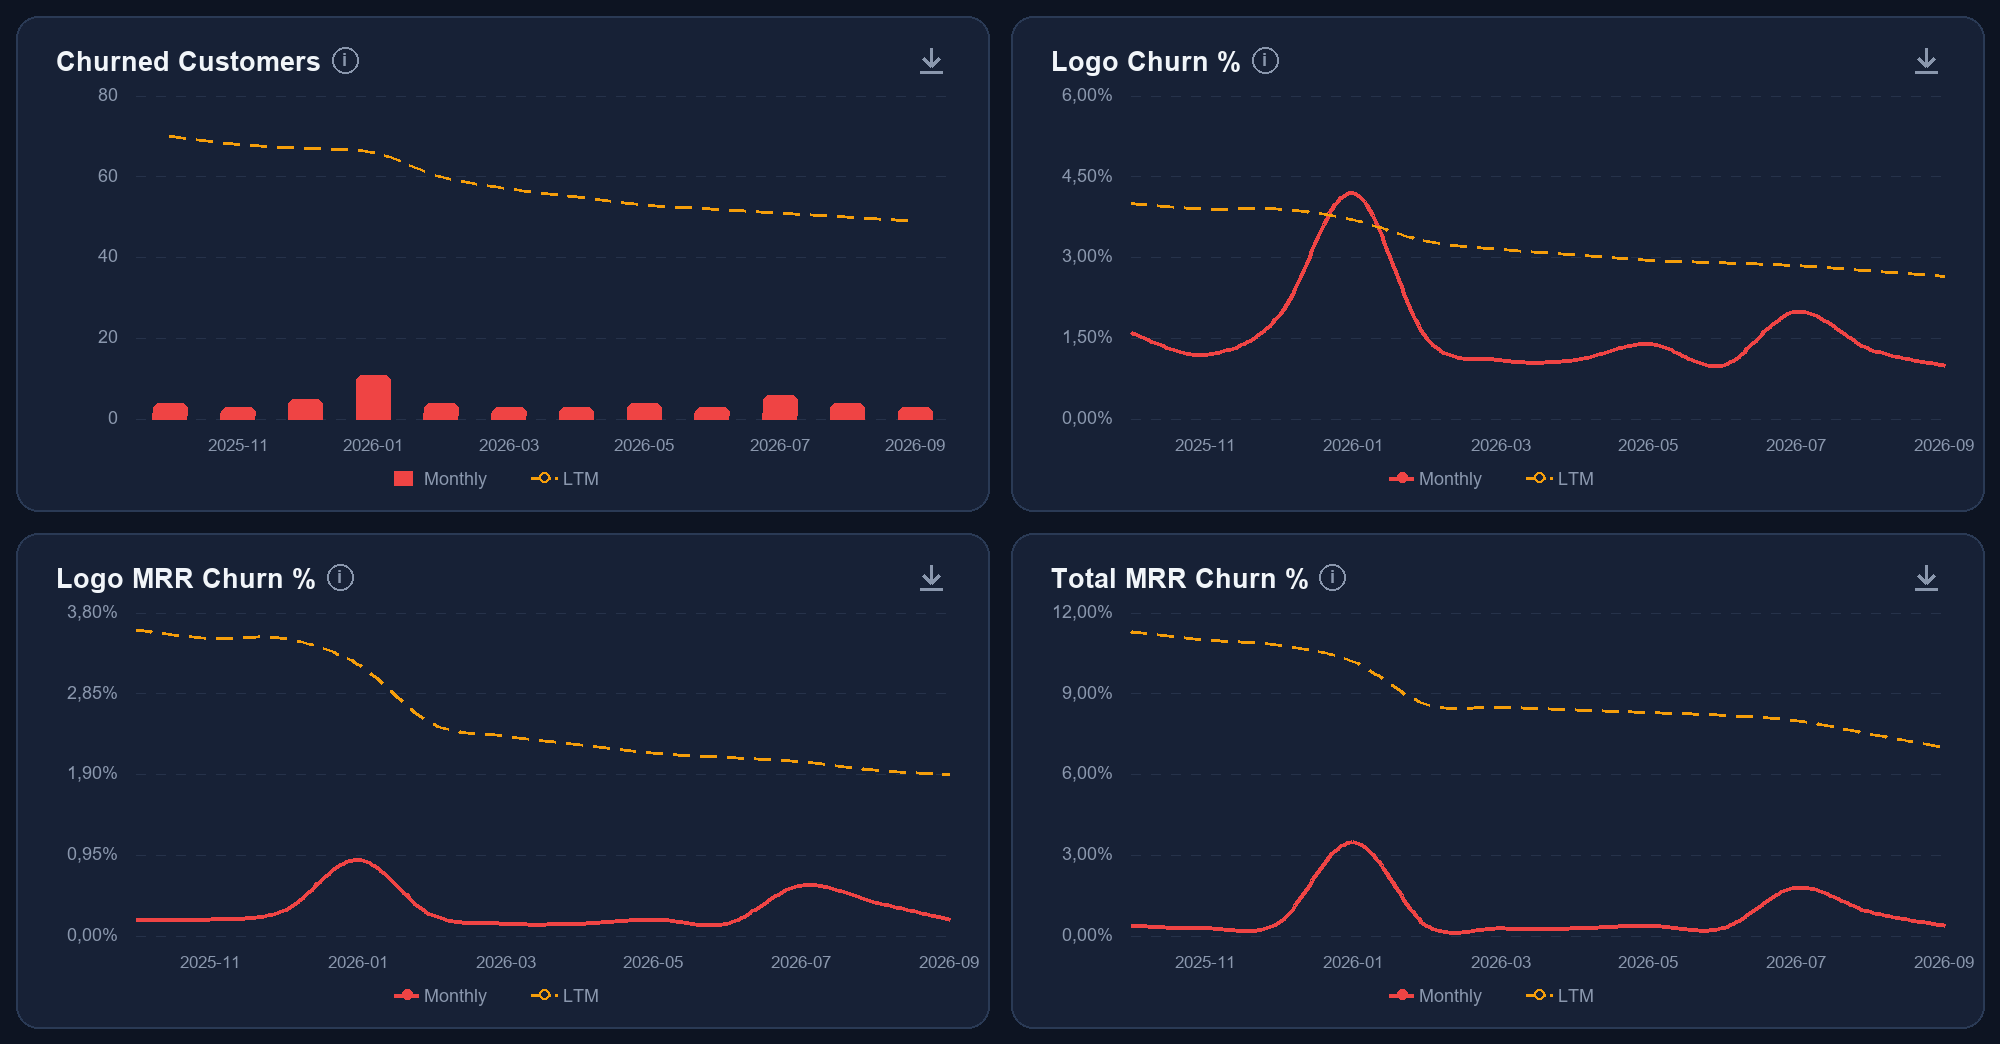
Churn is the share of your customers or your revenue that leaves in a period. There are two versions, and they tell you different things.
Customer churn
customer churn = customers lost in the period ÷ customers at the start of the period
Counts heads. A fairer picture when you have many different plan sizes.
Revenue churn
revenue churn = MRR lost in the period ÷ MRR at the start of the period
Counts euros. Shows whether you are losing large or small customers.
MRR stands for Monthly Recurring Revenue: your recurring revenue converted back to one monthly value. How you calculate it is covered in this article.
Calculate both. They often diverge, and that difference is exactly what is informative.
Why you need both
Take a month that starts with 200 customers and €140,000 MRR. Four customers leave, together worth €5,600 MRR.
- Customer churn: 4 / 200 = 2.0%
- Revenue churn: €5,600 / €140,000 = 4.0%
Your customer churn looks manageable. Your revenue churn is double that. This means the customers who left were above-average in size: on average €1,400 a month, against €700 for your whole base.
The reverse is possible too. Twelve small customers leaving give 6% customer churn and perhaps 1.5% revenue churn. Annoying, but a different problem, and one you solve differently.
Anyone tracking only customer churn misses the first case. Anyone tracking only revenue churn misses the second.
Gross and net
There is one more distinction that often gets blurred.
Gross revenue churn counts only what leaves: cancellations and contraction at customers who stay.
Net revenue churn subtracts the expansion at existing customers from that. If your existing customers have expanded more than what left, your net churn is negative, and that is good news.
Negative net churn means your customer base grows without a single new customer joining. That is the same measurement as net retention, seen from the other side. That is what this article is about.
The danger of net churn is that it masks the gross movement. One large expansion can hide three cancellations. So report them side by side, never the net alone.
The choice that shifts your churn by months
Here is the pitfall that makes the most difference, and that is rarely made explicit: when does a cancellation count?
A customer on an annual contract cancels in March, with an end of term in December. Two defensible answers:
- On the cancellation date. The customer leaves your churn in March. You see the problem straight away, and that is the point of a steering figure.
- At the end of the term. The customer leaves your churn in December. This aligns with your revenue recognition, but your steering figure runs nine months behind reality.
For steering, the first is almost always the right one. You want to know a customer is gone the moment they make the decision, not nine months later.
But be aware: your revenue and your MRR then diverge, and that is not an error. They answer different questions. Anyone who confuses them reports growth that has already gone in the steering.
Over what period do you measure?
Measure per month. A quarterly or annual figure hides exactly the spikes you want to see.
If you want to translate a monthly figure into an annual one, use:
From month to year
annual churn = 1 − (1 − monthly churn)^12
Not times twelve. At 2% a month that is 21.5% a year, not 24%. The difference looks small and becomes large as the percentages rise.
And then the real problem
You can calculate all of this precisely and still be too late.
Churn enters your accounting as loose events: a cancellation email, an invoice that stops, a line that disappears. There is no moment when something lights up red. The curve only appears when someone adds those events together and sets them against last month, and that happens, if it happens, somewhere around the twelfth of the following month.
By then the spike is no longer a signal. It is a fact you are managing.
There is a second delay in it. Your topline meanwhile looks fine, because new sales temporarily mask the cancellations. Your revenue rises in April, and in June you discover that a churn spike has already eaten the quarter. The data was there. It was hidden in mutations no one gathered together in time.
The test
Three questions. If the answer to one of them starts with "I would have to look that up", then you have the problem:
- How many customers have you lost in the past three months, and how much MRR was that?
- Were those customers larger or smaller than your average?
- Which customers have contracted in the past three months without cancelling?
That third one is the hardest. Contraction without cancellation is the earliest warning there is: a customer going from fifteen to eight users is often gone within two quarters. But contraction generates no event. No email comes. There is only an invoice line lower than last month, and no one compares invoice lines.
Where this comes from
Churn is one of five movements that together form your revenue line: new customers, expansion, the existing base, contraction and cancellations. Together they are one number on your income statement. Apart, they tell a different story, and that breakdown is covered in this article.
The whitepaper The blind spot in Exact Online shows why your accounting records those five but shows them nowhere, why the monthly Excel exercise does not change that, and which four questions tell you within five minutes whether your business has this blind spot.
Read on: The blind spot in Exact Online
The whitepaper is online ungated, without registration. Read or download it, and afterwards you will know whether your revenue line hides a blind spot.