Of all the metrics around subscription businesses, ARPA is the easiest to calculate and the easiest to misread. It is one division. And that very simplicity is why almost no one looks at it properly.
The formula
ARPA stands for Average Revenue Per Account: your average recurring revenue per customer.
ARPA
ARPA = MRR ÷ number of active customers
At €141,900 MRR and 203 customers: €699 ARPA.
MRR is your recurring revenue converted back to a single monthly value; how you build it up is covered in this article.
That is the whole calculation. You will also come across ARPU (Average Revenue Per User), which is something else: per user rather than per customer. For a business that bills per user, both are useful. For everyone else, ARPA is the number.
What exactly you divide
Two pitfalls, both in the denominator.
Count only active customers. Customers who have cancelled but run on until the end of their term no longer belong in it, since they are no longer in your MRR either. Include them and your ARPA drops without anything having happened.
Decide what one customer is. A group with four operating companies: one customer or four? The answer changes your ARPA by a factor of four and it changes your customer churn at the same time. Both are defensible, but it has to be the same every month.
And keep the numerator clean: only recurring revenue, no implementation, extra work or hours.
Why the number is treacherous
An average hides a distribution. That is no news, and yet here it is the whole point.
Take two businesses with exactly the same ARPA of €699:
- Business A has 200 customers who all pay between €500 and €900. Lose one, and you lose half a percent.
- Business B has 197 customers around €400 and six customers of €12,000. Lose one of those, and you lose eight percent of your revenue in a single phone call.
Identical ARPA, completely different risk. So always look at the median alongside the average. If the two diverge widely, there is concentration in your base and ARPA is a poor summary figure.
The movement that matters
What is interesting about ARPA is not the level but the direction, and above all the direction combined with your customer count.
| Customer count | ARPA | What is happening |
|---|---|---|
| Rising | Rising | You are winning larger customers or your existing ones are expanding. The best scenario. |
| Rising | Falling | Your new customers are smaller than your existing ones, or you are losing your biggest. Needs looking into. |
| Falling | Rising | You are losing small customers. Annoying, but rarely acute. |
| Falling | Falling | You are losing your large customers. This is the scenario you would have wanted to see months earlier. |
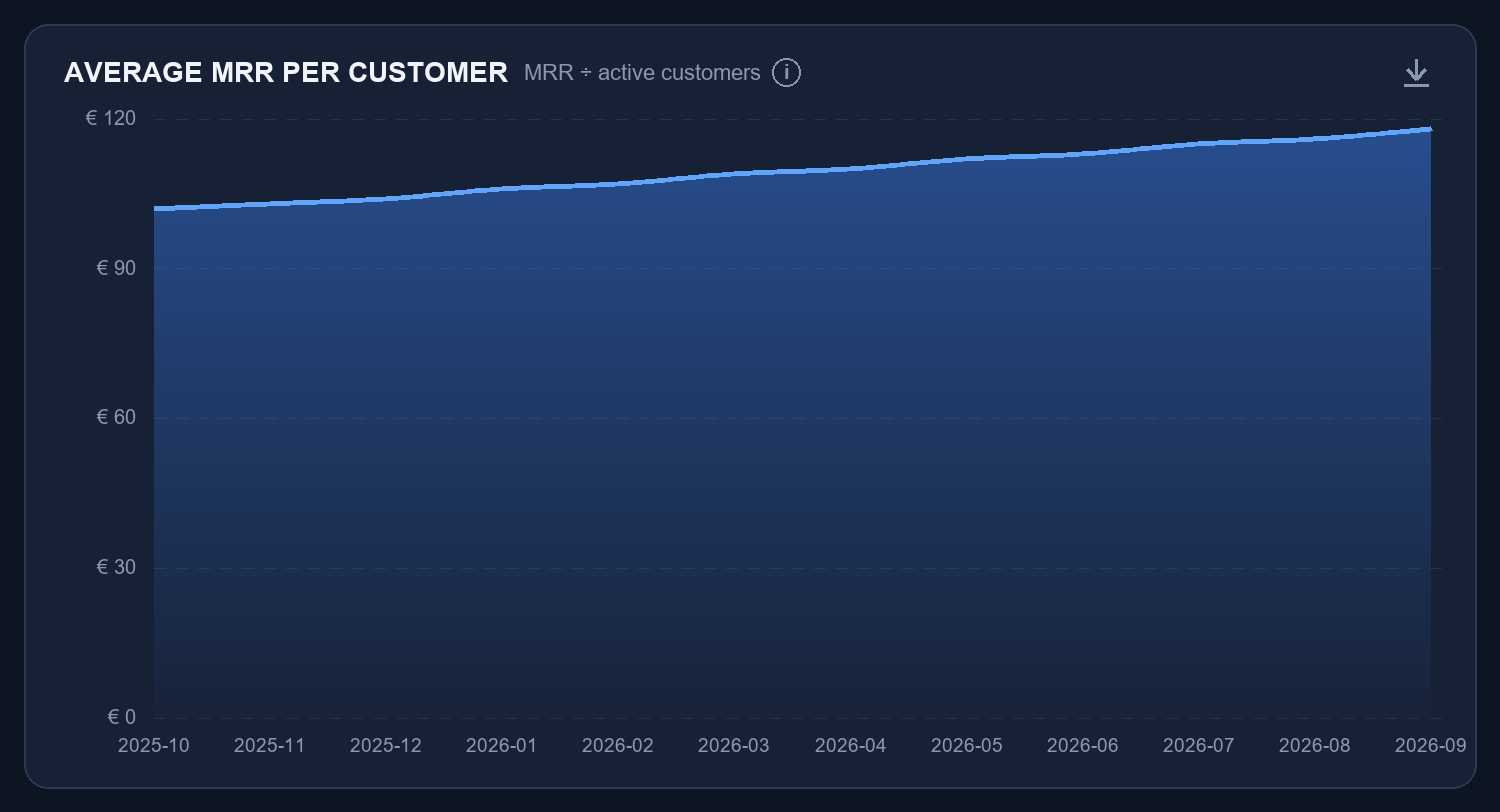
Row two is the interesting one, because there something happens that stays invisible on your revenue line.
The scenario where no one notices anything
Say your customer count grows from 180 to 203, a tidy 13% increase. Your ARPA drops from €780 to €699, down 10%. Your MRR goes from €140,400 to €141,900.
Growth of one percent. On your revenue line almost nothing happens, so no one looks further.
Underneath, plenty is going on. You are winning 23 net more customers, that is sales doing well. And at the same time your average falls by ten percent, which means those new customers are considerably smaller than what you had, or a few large ones have left.
Those two call for a completely different conversation. If your new customers are smaller, your positioning or your pricing is shifting and you need to know whether that is deliberate. If your large customers have left, you have an acute retention problem in your most important segment.
From ARPA alone you cannot tell which of the two it is. For that you need the breakdown of your MRR: new, expansion, existing, contraction and churn side by side. That is covered in this article.
Where ARPA does teach you something
For new customers separately. Calculate the ARPA of only the customers who joined this month, and set it against your total ARPA. If it runs structurally lower, your average is pulled a little further down every month, and that is a trend you can see coming a year ahead.
Per cohort. The ARPA of customers who joined last January, measured today, against the ARPA of this January. If it rises, customers are growing with you. If it falls, they are scaling down. More on cohorts.
Per segment. One average across your whole base says little if you sell to two different types of business. Two averages say a lot.
Why this does not come out of your accounting
Your bookkeeping knows your revenue and your receivables. ARPA asks for your MRR divided by your active customers, and both those figures are not a booking but a derivative.
Your MRR asks for normalisation of contract forms. Your active customer count asks for a decision about who is still in it, including the cancelled customer still running on. And the movement that makes it interesting asks for a comparison with last month, and your accounting does not keep that snapshot.
That is exactly what the whitepaper The blind spot in Exact Online describes: your accounting records every point, but the line those points form is nowhere.
Read on: The blind spot in Exact Online
The whitepaper is online ungated, without registration. Read or download it, and afterwards you will know whether your revenue line hides a blind spot.