Your churn has been around 2% a month for two years. Stable, manageable, no cause for concern.
And yet it may be that last year's customers did considerably better than this year's, and that you only see it in your total figure a year and a half from now. A total average mixes old and new customers together, and old customers are by definition the customers who did not leave.
A cohort analysis pulls those two apart.
What a cohort is
A cohort is a group of customers who joined in the same period, followed over time. All customers who became a customer in January 2026 are together the January cohort, and they stay that, even if half of them are gone again in March.
The whole art is in that "and they stay that". A cohort never gains anyone. Only because of that can you fairly compare January with June.
How you build the table
Per cohort, per month after joining, how many are still left. That can be in customers or in revenue.
| Cohort | Month 0 | 1 | 2 | 3 | 6 | 12 |
|---|---|---|---|---|---|---|
| Jan 2026 | 100% | 96% | 93% | 91% | 86% | 79% |
| Feb 2026 | 100% | 95% | 92% | 90% | 85% | — |
| Mar 2026 | 100% | 94% | 89% | 85% | 78% | — |
| Apr 2026 | 100% | 92% | 86% | 81% | — | — |
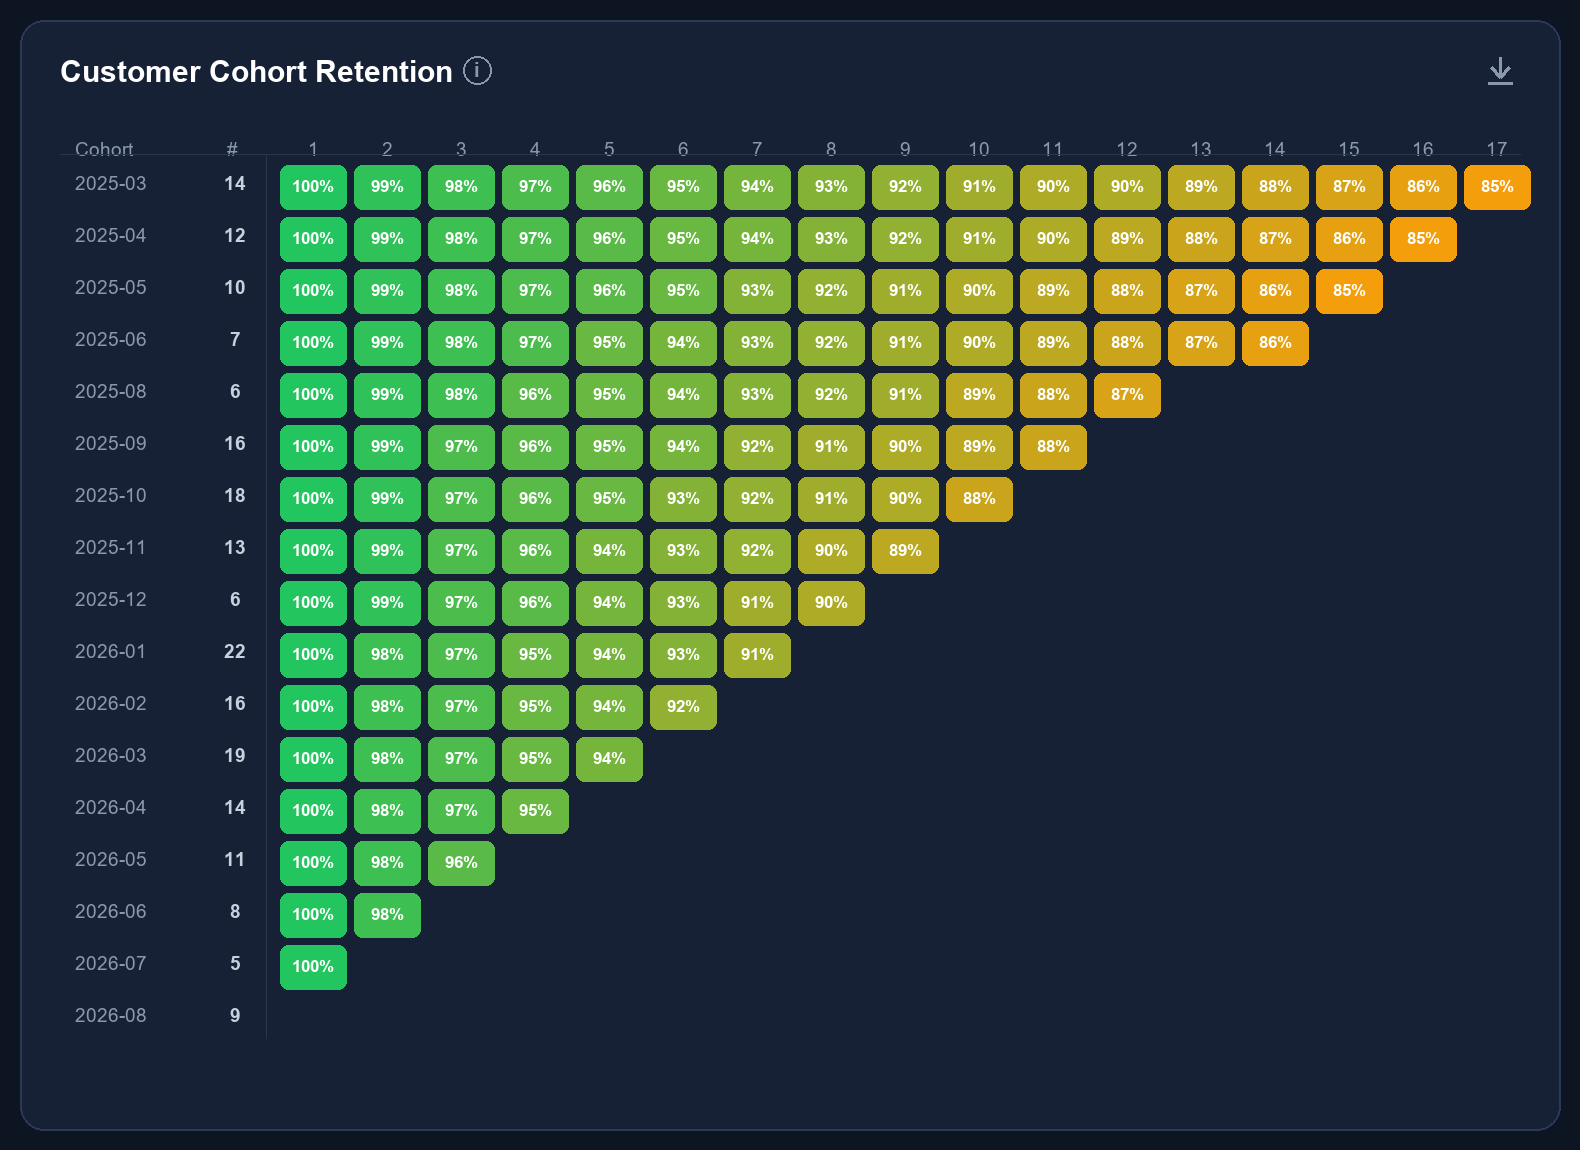
Month 0 is always 100%: that is the cohort at joining. The staircase runs to the right because customers fall away, and the rows get shorter the younger the cohort is, an April cohort cannot yet have twelve months.
Read it vertically, not horizontally. A column shows how different cohorts do at the same point in their life. Column 3 above goes from 91% to 81% over four months. That is a product or a sales process deteriorating, and in your total churn none of it is yet visible.
Why the total figure hides this
Take the example above. You have a growing base with many customers from 2025 who are all still there, and a growing intake in 2026 that does less well.
Your total monthly churn is dominated by the large, stable group of old customers. The worse retention of the new cohorts disappears into that average, until those cohorts are large enough to shift the average. At a healthily growing business that easily takes a year and a half.
A year and a half in which you could have known.
The three questions a cohort table answers
Am I getting better or just bigger? Look at one column, for example month 6, from top to bottom. If it rises, newer customers hold on better, the product, the onboarding or your customer selection has improved. If it falls, the reverse is true.
Where is the drop-off moment? Look at one row. Where is the biggest step? If it is between month 0 and 1, it is an onboarding problem: people came in and never arrived. If the step is at month 12, it is a renewal moment, there sits an annual contract expiring and a decision being taken again.
Has the curve flattened? Almost every cohort curve drops quickly and then flattens. The point where it flattens is your core: the customers who stay. If it does not flatten but keeps sinking steadily, there is no core and every cohort eventually drains empty.
Customers or revenue
Do both, because they tell you different things.
Customer retention counts heads. Simple, and good for onboarding and product questions.
Revenue retention counts euros, and then a cohort can come out above 100%, if the customers who stayed started taking more than the leavers took away. That is the same measurement as net retention, per cohort instead of across your whole base. That is what this article is about.
A cohort with 79% customer retention and 104% revenue retention describes a business that loses a fifth of its customers and still earns more from them. That is a perfectly legitimate model, but you do have to know it.
What you need to build this
Three things, and it is exactly three:
- Joining month per customer. Immutable. A customer who leaves and returns belongs in their original cohort, unless you apply an explicit boundary.
- MRR per customer, per month, for every month since joining. This is the bottleneck.
- A rule for when a customer leaves the cohort. At the cancellation date or at the end of the term. The same choice as with churn, and it has to be the same.
Point two is where it runs aground for nearly everyone. A twelve-month cohort table requires twelve historical snapshots of your customer base, and your accounting does not keep those. Your accounting keeps bookings, not composition.
Anyone who never wrote away the MRR per customer monthly cannot make a cohort table retroactively from the bookings alone: you can reconstruct the amounts, but not with certainty who was active when and how that was classified at the time.
Start today, even without a tool
One line per customer per month: customer number, joining month, normalised MRR. No more.
Twelve months from now you then have a real cohort table. If you do not, the answer to "what does your cohort retention look like?" is still, a year from now, that it has to be looked into, and that is exactly the moment someone asks it.
Why this rolls out nowhere by itself
A cohort is not a property of a customer or of a booking. It is a property of a group over time, and so can only be constructed from a series of snapshots no one keeps.
That is the same reason MRR movement, churn and net retention do not roll out of it. Your accounting records what has happened. It is not built to show what is happening. That distinction is the subject of the whitepaper The blind spot in Exact Online.
Read on: The blind spot in Exact Online
The whitepaper is online ungated, without registration. Read or download it, and afterwards you will know whether your revenue line hides a blind spot.